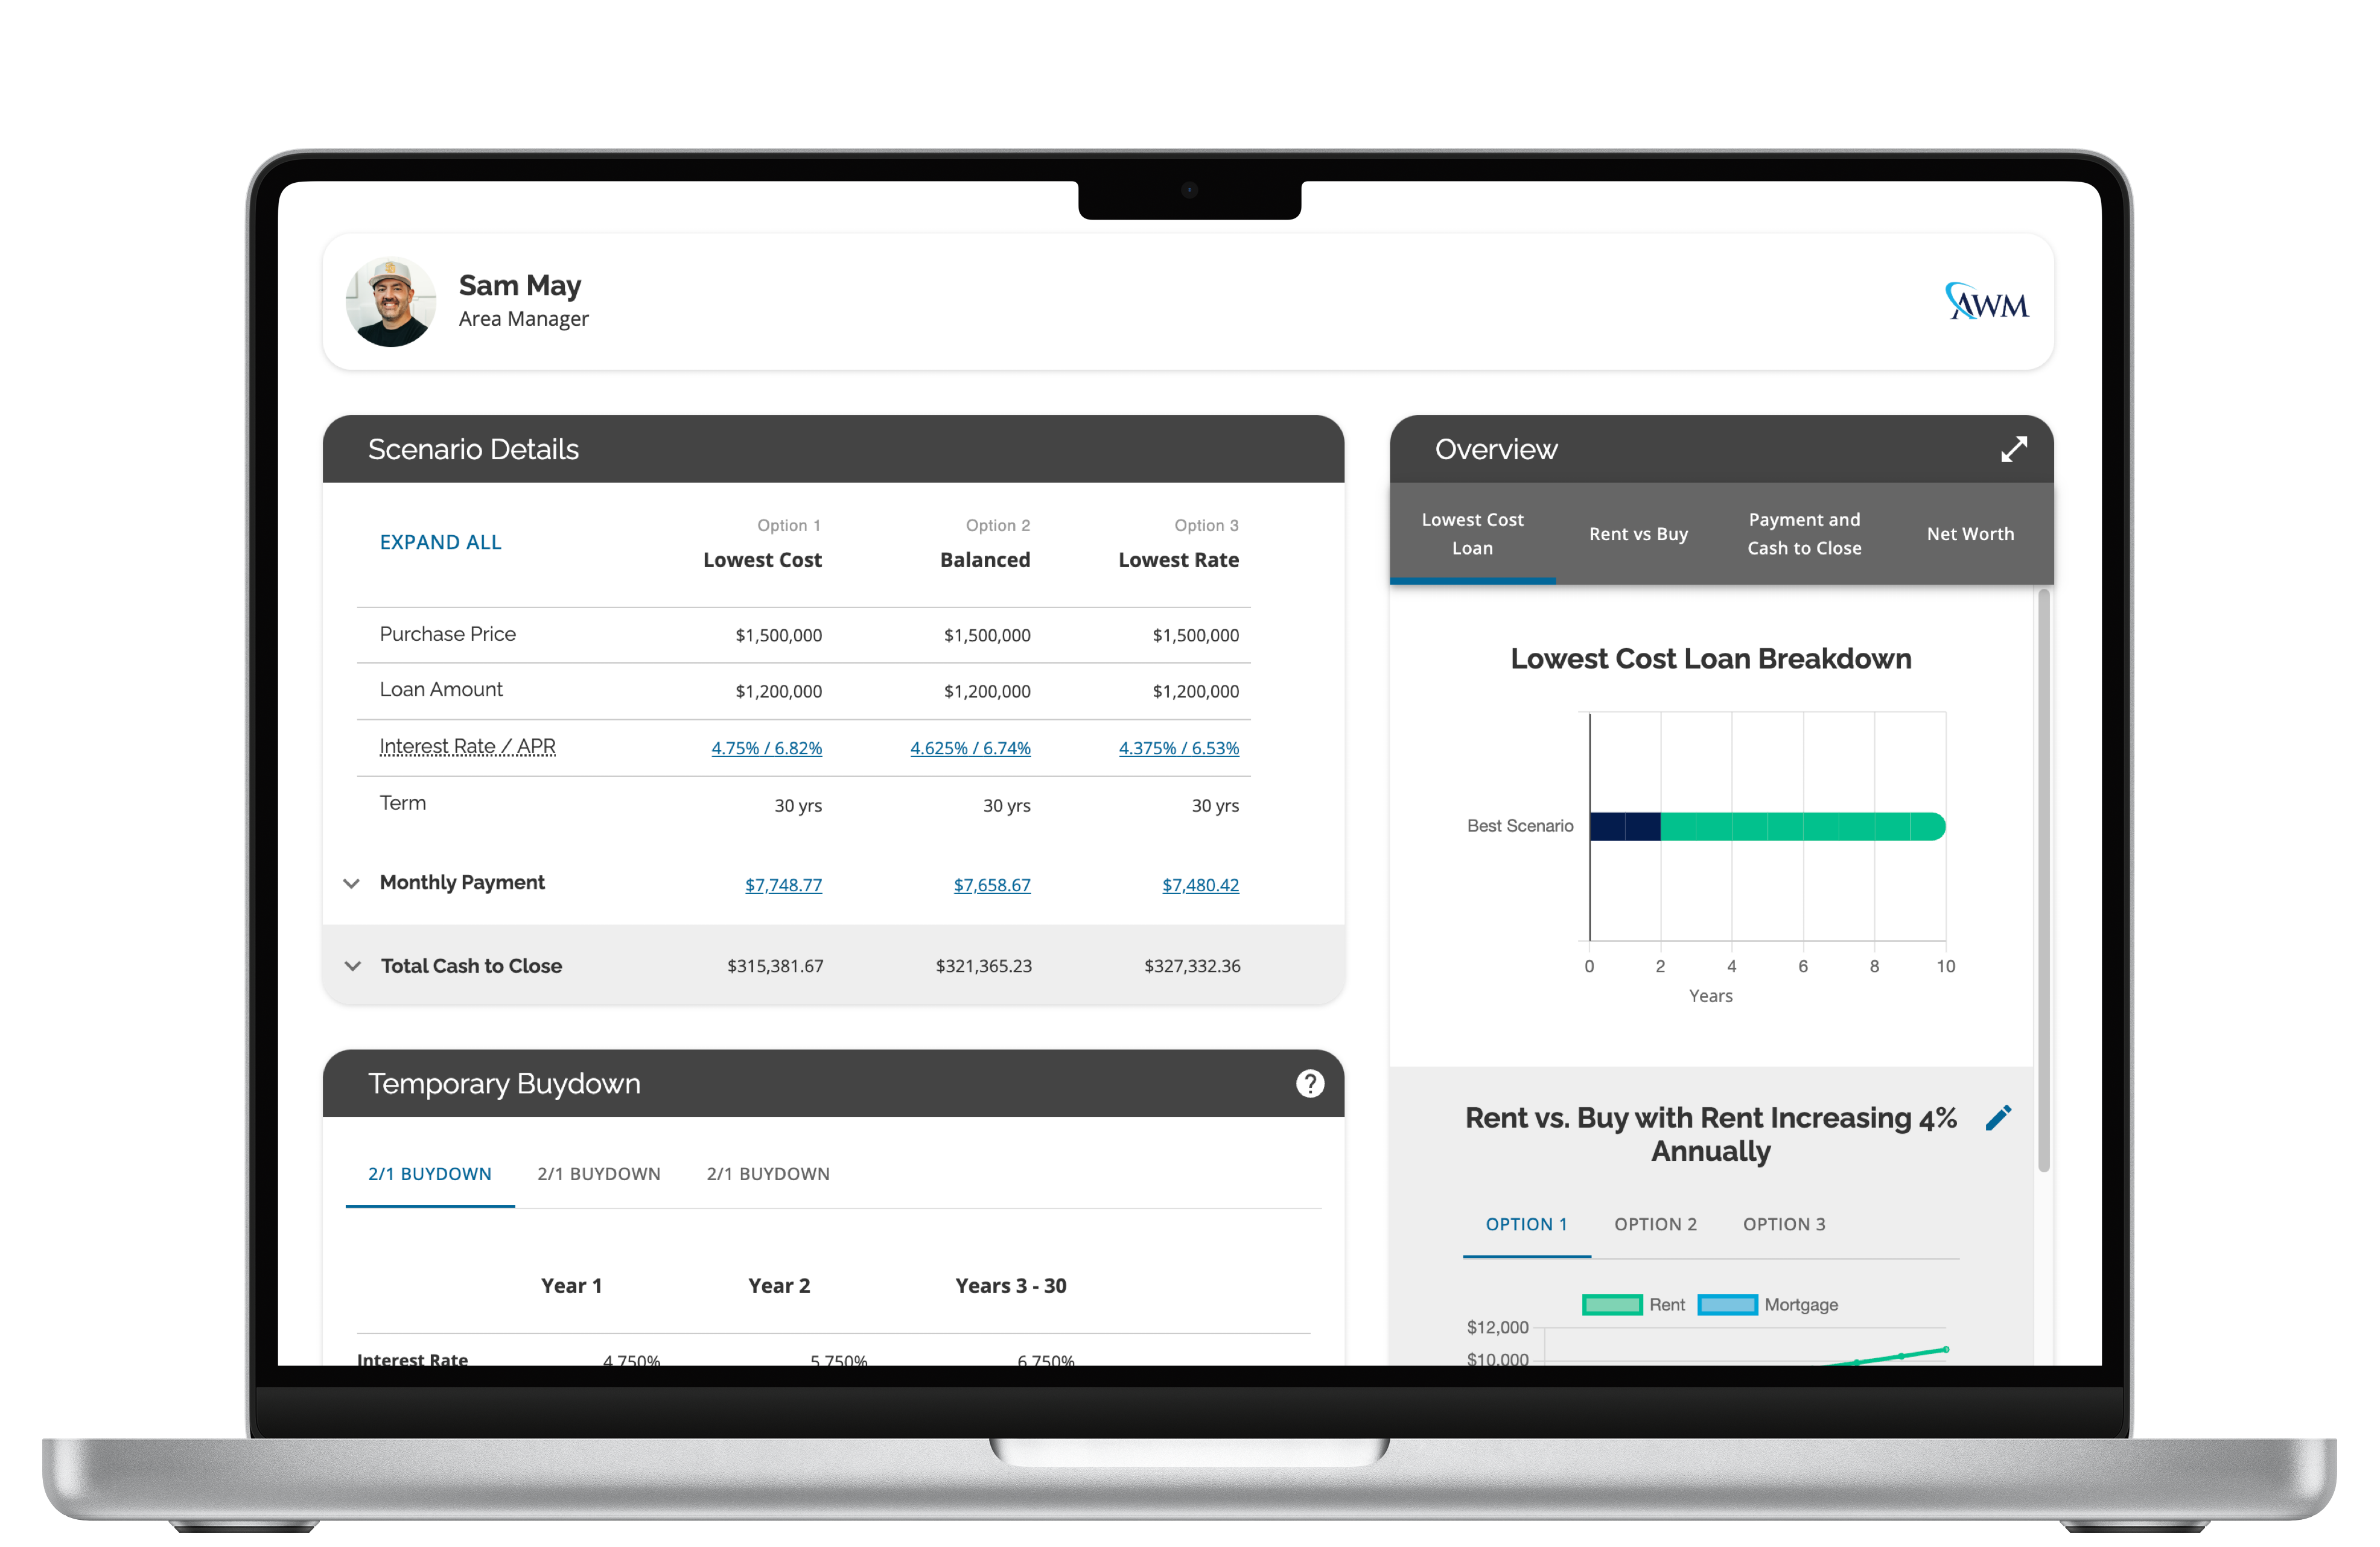
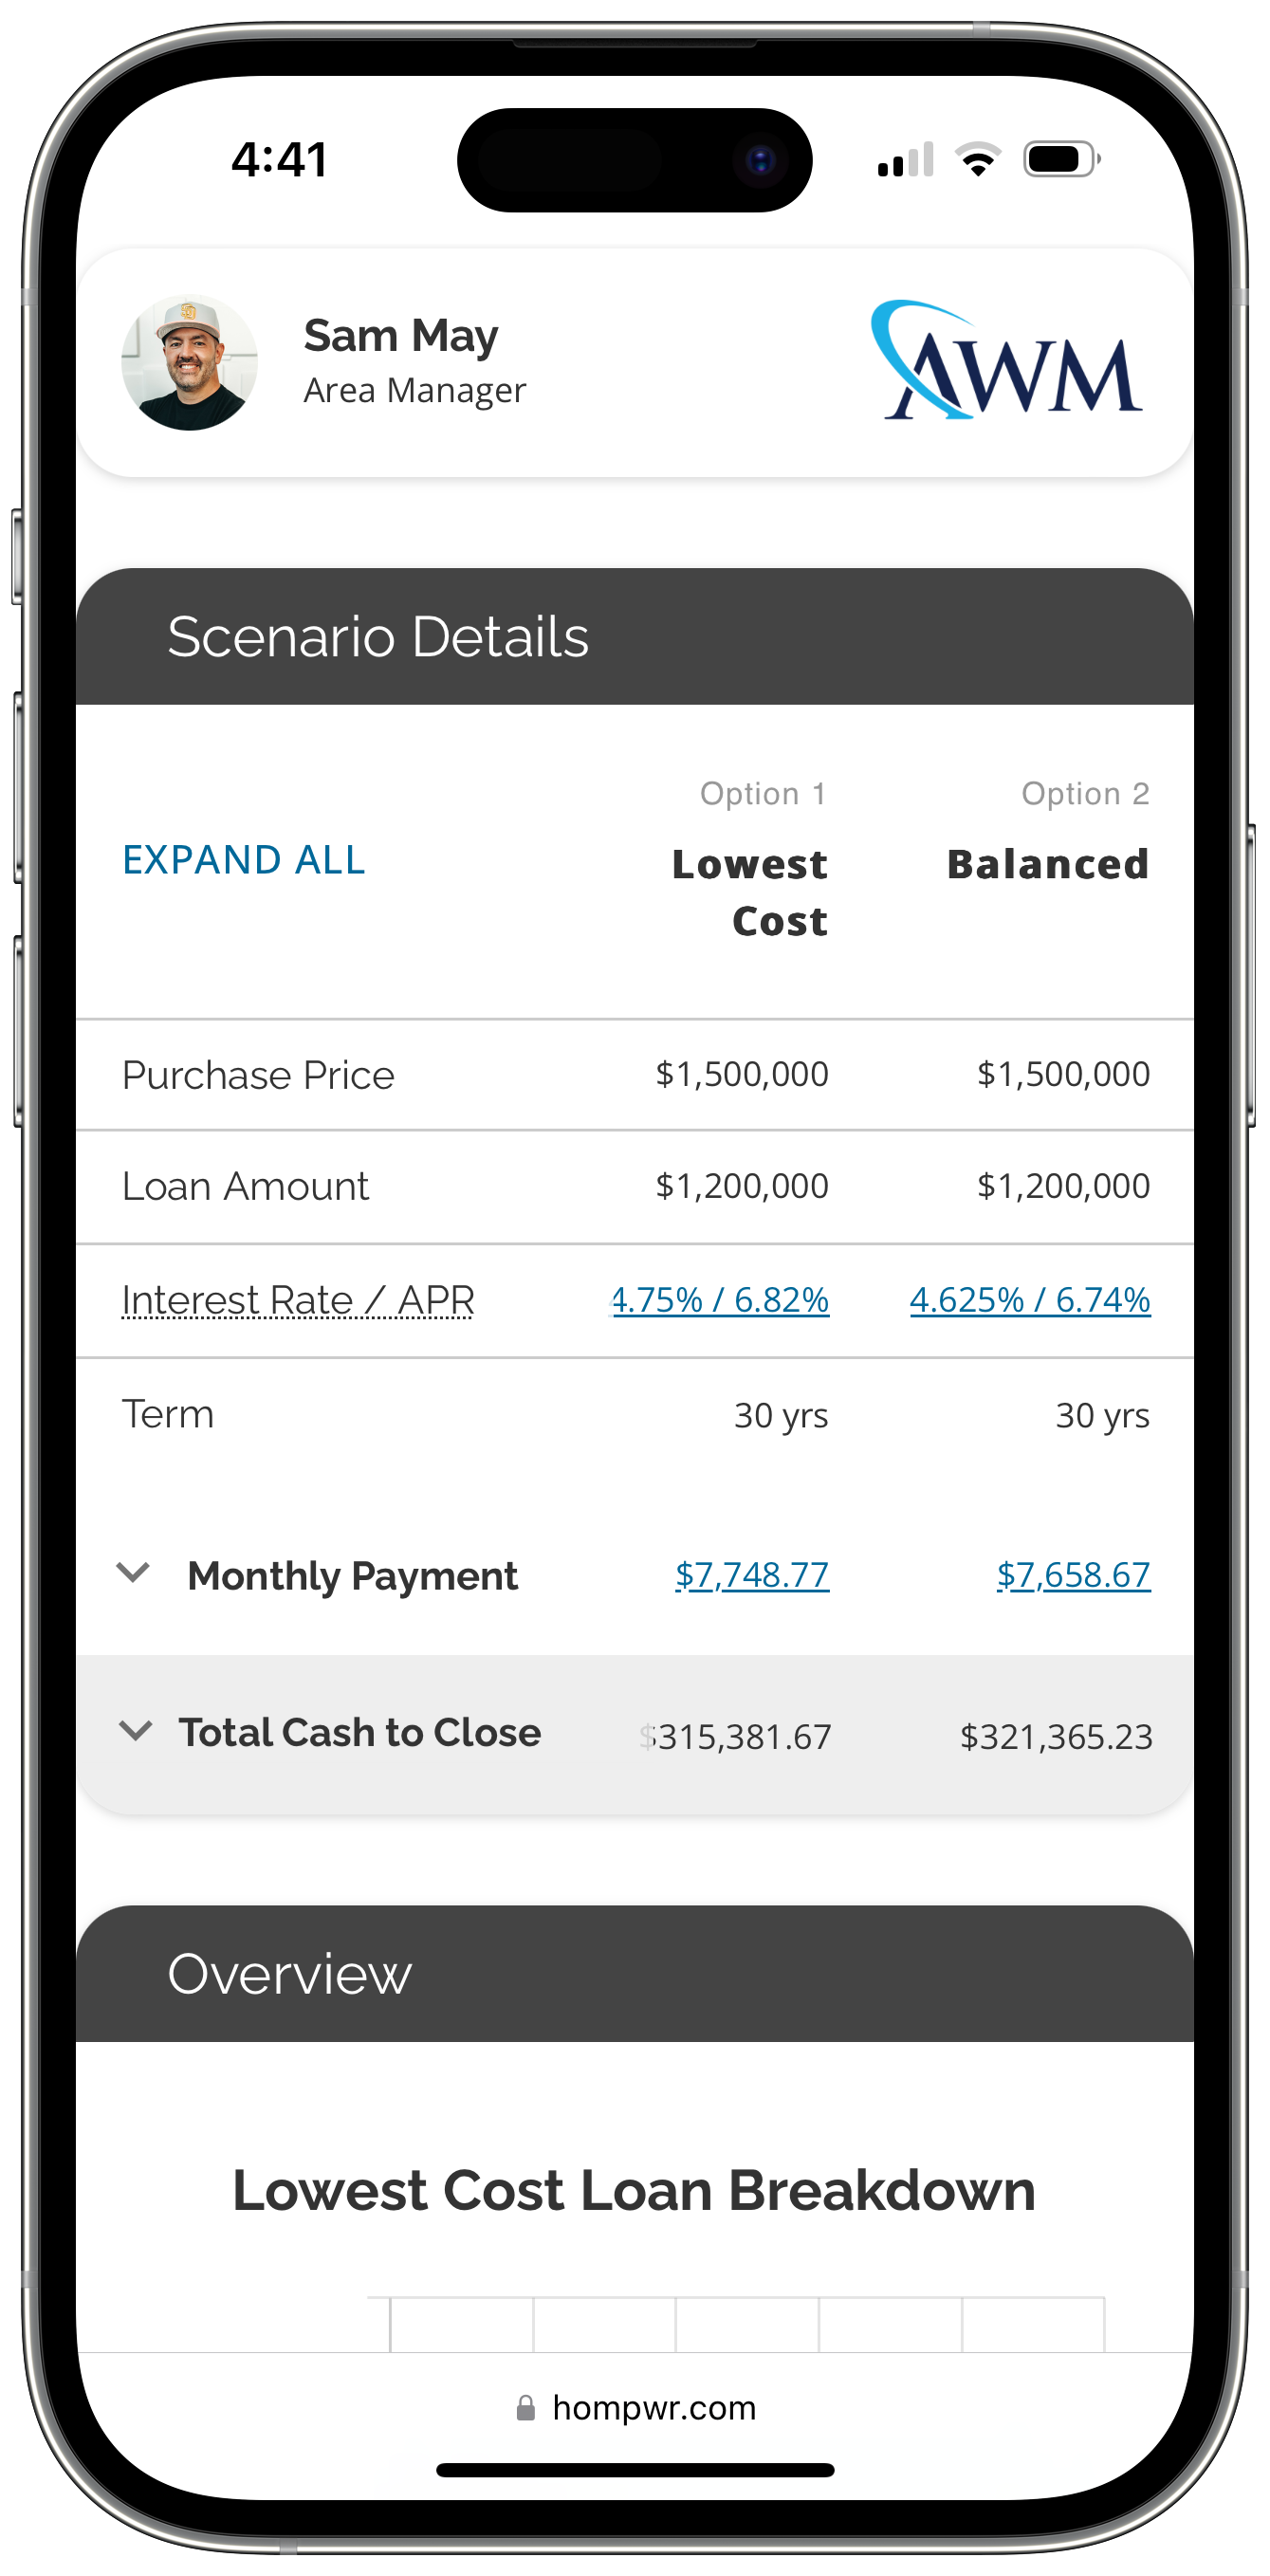
Meet the Quote Machine
See how the Quote Machine helps you simplify robust financing strategy, and convert at a higher level.


Intel that drives decision making.
Key insights that were once buried in a sea of numbers, now shown with simple graphics
Interactive charts let your clients explore and realize the benefits you can provide, faster.
%
Expected annual property appreciation
yrs
Screen record included
We have a passion for shrinking your tech stack, if you couldn't tell.
Play out "what if's" with ease
Questions like: "What if my payment stayed the same?" and "What if I paid off the new loan in the same time?" answered with quote-wide updates at the flip of a switch.
Overcome objections
Demonstrate pros and cons that other lenders can't.
Enhanced borrower experience
Borrowers can adjust all charts and additional principal settings without affecting your presets.
Debt consolidation
Evaluate incremental debt consolidation advantages in real time.
How it works
Build
Set up a baseline scenario, with all the complexity you can imagine.
What is client confusion costing you?
Give Hompwr a spin and turn clients into raving fans.
